
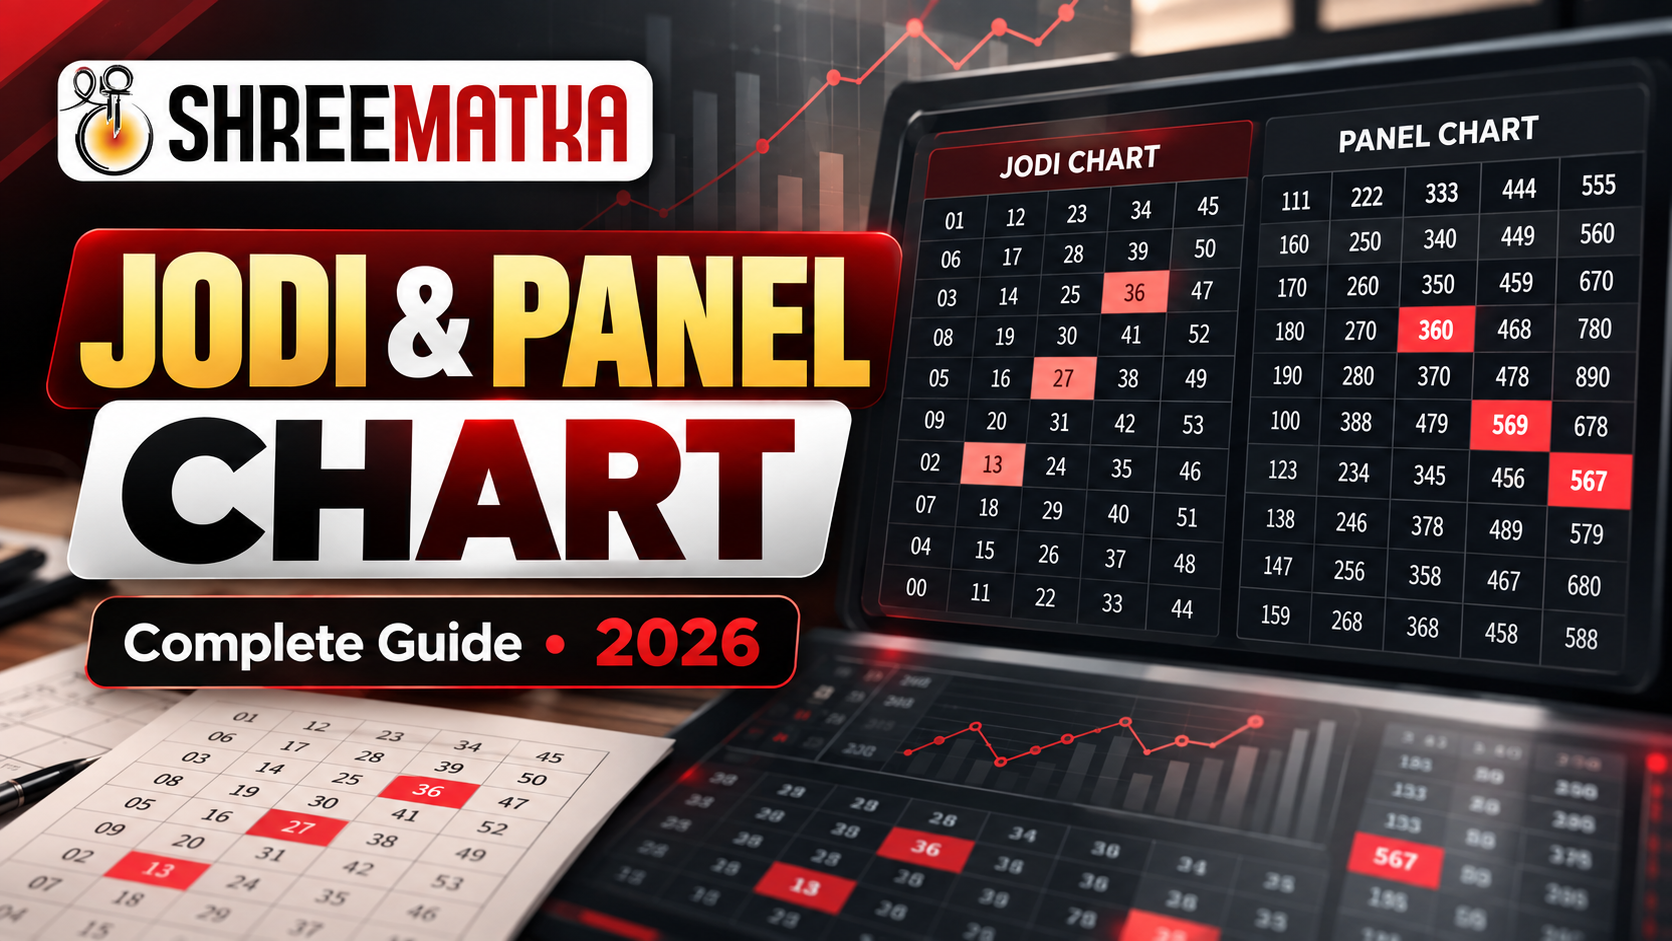
What Is a Satta Matka Jodi Chart?
In the terminology of the Indian numbers market, the word Jodi translates directly to "pair" or "couple." A Satta Matka Jodi Chart is a chronological reference table that documents the two-digit numeric outcome declared for a specific marketâ€â€such as Kalyan, Main Bazar, Milan Day, or Rajdhani Nightâ€â€for every active trading day of the calendar year.
Every day's market result consists of two operational sessions: the Open session and the Close session. Each session produces a single root digit between 0 and 9. When the Open single digit and the Close single digit are placed side-by-side, they form a two-digit compound number between 00 and 99. That two-digit figure is known as the day's Jodi.
On a standard Satta Matka result chart, Jodi records are organized in a clean matrix. The vertical rows represent sequential calendar weeks, while the horizontal columns correspond to the active operating days of that market (typically Monday through Saturday or Monday through Sunday). By glancing across a single row, an analyst or reader can observe the day-to-day sequence of declared pairs for that entire trading week.
What Is a "Red Jodi"?
When reviewing a traditional printed or digital Matka Jodi Chart, you will occasionally notice certain cells highlighted in bright red text while the majority of cells are displayed in black or dark gray. These are designated as Red Jodis. A Jodi is classified as "Red" under two specific mathematical conditions:
- Identical Pair (Double Digits): When both the Open digit and Close digit are exactly the same number. The ten possible identical pairs are
00, 11, 22, 33, 44, 55, 66, 77, 88, 99. - Cut Number Pair (Half-Cycle Symmetry): When the Close digit is the arithmetic "Cut" (complementary half-cycle digit) of the Open digit, calculated by adding 5 modulo 10. For instance, the cut of 1 is 6, the cut of 2 is 7, and so forth. Symmetrical cut pairs include
16, 61, 27, 72, 38, 83, 49, 94, 05, 50.
In traditional chart reading, Red Jodis are considered visual milestones representing cycle resets or harmonic symmetry within the sequence. However, from a strict mathematical standpoint, each two-digit combination from 00 to 99 carries an identical probability of 1 in 100 in an unbiased draw.
What Is a Satta Matka Panel Chart?
While a Jodi chart gives you the finished two-digit picture, it does not reveal how those two digits came into existence. That is the function of the Satta Matka Panel Chart (frequently referred to as a Pana Chart or Patti Chart).
A Panel (Pana or Patti) is a three-digit combination drawn between 000 and 999. In standard Matka market rules, the three digits within any panel are always arranged in ascending numerical order (for example, 1-4-8, never 8-1-4 or 4-8-1). The sum of these three digits is then added together, and the single unit (the rightmost digit) of the total sum becomes the official single root digit.
Therefore, a complete Matka Panel Chart records eight distinct numerical digits for every day of market activity, presented in a standard tripartite format:
3-Digit Open Pana (e.g., 148)
2-Digit Jodi Pair (e.g., 37)
3-Digit Close Pana (e.g., 269)
The Three Primary Types of Panels
There are a total of 220 recognized possible panel combinations in traditional Matka games, grouped into three distinct categories based on digit duplication:
-
Single Pana (SP): A three-digit panel in which all three digits are completely unique and arranged in ascending order. Examples include
123, 148, 359, 478. There are 120 unique Single Panas. -
Double Pana (DP): A three-digit panel containing two identical digits and one unique digit, arranged in non-descending order. Examples include
112, 225, 488, 779. There are 90 unique Double Panas. -
Triple Pana (TP): A three-digit panel in which all three digits are identical, commonly known as a "Jackpot Pana" or "Motor." Examples include
000, 111, 222, 333, 444, 555, 666, 777, 888, 999. There are exactly 10 Triple Panas.
Because Single, Double, and Triple Panas have drastically different mathematical occurrence odds, Panel charts allow observers to study how often double and triple variations appear compared to standard single distributions over lengthy historical periods.
Jodi Chart vs Panel Chart: Key Differences
Newcomers to Matka analytics frequently confuse these two chart formats or wonder which chart they should inspect when studying market behavior. The primary difference lies in the depth of information and the specific purpose of the analysis.
A Jodi chart is designed for broad macro analysisâ€â€tracking weekly open/close relationships, odd/even sequences, and cut pairs across months at a glance. A Panel chart is an audit-level record showing the underlying micro components that created each day's open and close digits.
| Comparison Dimension | Satta Matka Jodi Chart | Satta Matka Panel Chart |
|---|---|---|
| Data Displayed | 2 Digits (Jodi Pair) | 8 Digits (Open Pana + Jodi + Close Pana) |
| Visual Layout | Compact grid of 2-digit numbers by day & week | Expanded tripartite entries (Pana-Jodi-Pana) |
| Mathematical Scope | Permutations from 00 to 99 (100 outcomes) | All 220 Panas mapped to 100 Jodis |
| Primary Analytical Use | Macro-cycle tracking, Red Jodi detection, weekly repeats | Single/Double/Triple Pana distribution, sum verification |
| Complexity Level | Beginner friendly; easy to scan quickly | Intermediate to advanced; dense numerical data |
| Mobile Screen Footprint | Compact; fits comfortably on standard viewports | Requires responsive horizontal scrolling for 8 digits |
| Best For | Quick reference of daily outcomes across markets | Comprehensive audit of the entire draw cycle |
How to Read a Satta Matka Chart (Step-by-Step for Beginners)
Reading a Matka Chart for the first time can seem overwhelming because of the dense arrays of numbers and unfamiliar abbreviations. However, once you understand the basic four-step derivation process, reading any chartâ€â€whether for Kalyan, Time Bazar, or Main Bazarâ€â€becomes completely intuitive.
Step 1: Identify Market Name, Week Dates, and Columns
Always begin by confirming the header of the chart. Ensure you are inspecting the correct market and that the timeline corresponds to the calendar dates you wish to analyze. The top header row lists the days of the week: MON, TUE, WED, THU, FRI, SAT, SUN (some markets remain closed on Sundays or Saturdays, which will be marked with a dash or blank cell). Each row beneath represents one full calendar week.
Step 2: Decipher the Open Pana and Open Single Digit
During the morning or afternoon opening session, the market produces its first three-digit panel. To verify how the single digit was calculated:
2 - 4 - 7
2 + 4 + 7 = 13
13 → Unit digit is 3
Step 3: Decipher the Close Pana and Close Single Digit
Several hours later, the market conducts its second sessionâ€â€the closing session. A second three-digit panel is declared, and the identical unit-reduction process is applied:
1 - 7 - 9
1 + 7 + 9 = 17
17 → Unit digit is 7
Step 4: Combine Both Sessions into the Final Jodi
Once both sessions have concluded, the Open single digit (3) and the Close single digit (7) are joined sequentially to form the day's official Jodi: 37.
If you are looking at a Jodi Chart, you will see simply 37 in that day's box. If you are looking at a Panel Chart, you will see the complete record: 247 — 37 — 179.
Explore Real-Time Matka Charts in the App
Access clean, zoomable Jodi and Panel charts for 30+ markets with instant 1-second sync on the official MatkaFun Android application.
Understanding Historical Chart Data (What It Shows vs What It Cannot Prove)
In the study of probability and historical data, context is critical. Satta Matka charts are historical recordsâ€â€they tell an exact story of what occurred in the past. However, there is a fundamental philosophical and mathematical divide between understanding historical records and claiming they can predict future events.
What Historical Charts Actually Provide
When used responsibly for empirical study, historical charts offer valuable structural observations:
- Frequency Distribution: Over hundreds of draw cycles, you can observe whether certain digits or digit families have appeared more or less frequently than their theoretical average of 10% per single digit.
- Cluster and Gap Analysis: Historical records document "cold streaks" (digits that have not appeared for consecutive sessions) and "hot clusters" (digits that repeat across multiple consecutive days).
- Cut Number Symmetry: Analysts use charts to study how often closing sessions produce complementary cut numbers relative to opening sessions within the same trading week.
- Audit Integrity: Charts serve as a public, tamper-resistant archive verifying that payouts and results matched the actual declared historical panels.
What Historical Charts CANNOT Prove (The Gambler's Fallacy)
A critical cognitive trap that ensnares many beginners is the Gambler's Fallacyâ€â€the mistaken belief that if an event has happened frequently in the past, it is less likely to happen in the future, or conversely, that a number that has not appeared for a long time is "due" to win.
In any draw system based on random selection or mechanical extraction, each draw is mathematically independent. Yesterday's Jodi of 48 does not alter the physical probability of 48 appearing again today. A coin flipped five times that lands on heads still carries an exact 50% probability of landing on heads on the sixth flip.
Common Terms Used in Matka Charts (Glossary & Reference)
To navigate any Satta Matka Chart 2026 effortlessly, familiarize yourself with this verified glossary of standard market terminology:
| Term | Definition | Example |
|---|---|---|
| Ank / Single | Any single digit from 0 to 9 derived as the unit sum of a three-digit panel. | Digit 4 in 149 (1+4+9=14 → 4) |
| Jodi / Pair | A two-digit combined outcome from 00 to 99 joining Open and Close singles. | Jodi 47 |
| Pana / Patti / Panel | A 3-digit number drawn in strictly ascending order whose sum produces a single Ank. | 137 (sum 11 → single 1) |
| Single Pana (SP) | A panel consisting of three entirely unique digits (120 combinations exist). | 249, 368, 570 |
| Double Pana (DP) | A panel consisting of two identical digits and one unique digit (90 combinations). | 114, 226, 788 |
| Triple Pana (TP) | A panel where all three digits are identical (10 combinations). | 000, 333, 777 |
| Cut Number | The complementary mathematical digit obtained by adding 5 modulo 10. | Cut of 3 is 8; Cut of 0 is 5 |
| Family Jodi | A group of 8 related Jodis formed by replacing original digits with their cut numbers. | For 12: 12, 17, 62, 67, 21, 71, 26, 76 |
| Half Sangam | A combination of one 3-digit Pana and one 1-digit Ank across Open/Close sessions. | Open Pana 123 with Close Ank 7 |
| Full Sangam | The complete combination of both the 3-digit Open Pana and 3-digit Close Pana. | 123 x 456 |
| OTC (Open to Close) | A set of 4 digits tracked as strong candidates for both daily sessions. | OTC Pool: 1, 3, 6, 8 |
Common Mistakes Beginners Make When Reading Charts
Even experienced market observers occasionally stumble into analytical errors when parsing high-density chart archives. Review these five common pitfalls to ensure your chart reading remains accurate and disciplined:
1. Confusing Correlation with Causation
Observing that the digit 7 has appeared following the digit 2 on three consecutive Wednesdays is an example of historical correlation. It does not establish a causal mechanism forcing 7 to appear next Wednesday. Treating recurring sequences as predetermined physical laws leads to unrealistic expectations and financial missteps.
2. Misreading Panel Digit Sequencing
Remember that panels are always sorted in ascending numerical order. Beginners often write down combinations out of order (such as 7-1-4 instead of 1-4-7) when calculating sums, which causes confusion when checking official record tables. Always normalize panel digits in ascending sequence before conducting analysis.
3. Falling for "VIP Leak" and "Fixed Jodi" Scams
Unscrupulous online operators frequently crop screenshots of real Jodi charts and claim to possess "company-insider leak numbers" or "sure-shot fixed jodis" available for an upfront fee. In reality, legitimate historical charts are public domain records; no third party has advance access to random draw events. Never pay advance fees for alleged predictions.
4. Ignoring Market Schedules and Operating Days
Different markets operate under different calendar rules. For instance, some markets run 7 days a week, while traditional bazaars like Kalyan or Main Bazar historically operate Monday through Friday or Saturday. Beginners who misalign weekday columns end up comparing results across incorrect days.
5. Neglecting Bankroll and Budget Management
Engaging with numbers games without strict financial boundaries is the most dangerous error of all. Chart analysis should remain an intellectual or entertainment exercise. Never allocate funds intended for essential living expenses, savings, or debt repayment.
Responsible Play & Regulatory Disclaimers
Please observe the following mandatory safeguards:
- Legal Age: You must be 18 years of age or older (or the age of legal majority in your jurisdiction) to participate in any numbers-based entertainment.
- Jurisdictional Compliance: Gaming regulations vary widely across different Indian states and international territories. It is your personal responsibility to ensure full compliance with the legal statutes of your local jurisdiction.
- Strict Personal Limits: Always establish an absolute discretionary budget before engaging in any gaming activity. Never chase losses or borrow funds to play.
- Support Resources: If you or someone you know is experiencing difficulties with compulsive gaming, seek assistance immediately from recognized support organizations.
Frequently Asked Questions
What is a Jodi chart in Satta Matka?
What is a Panel chart (Pana chart) in Satta Matka?
148 - 37 - 269.
What is the primary difference between a Jodi chart and a Panel chart?
How do you calculate a single digit from a three-digit Panel?
Can historical Satta Matka charts predict future winning numbers?
What does a Red Jodi mean on a Matka chart?
Is a Matka chart the same as a live result chart?
Where can users find verified and updated Jodi and Panel charts?
Explore Satta Matka Charts on the MatkaFun App
Stay informed with instant 1-second live results, comprehensive historical Jodi and Panel records, and verified game rate tables directly on your Android device.
Download Official App
Comments (0)
Loading comments...